

By Alicia Rosenberger
This data is from the lumber industry, giving the approximate number of board feet of lumber per tree in a forest of a given age.
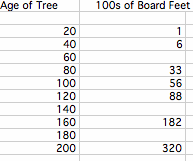
Next we want to use this data to see if there is a relationship between the age of the tree and the board feet per tree, and we want to fill in the table and to also know other values. To do this we will need to first graph the data points.
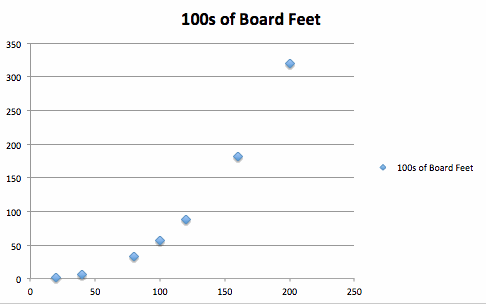
Next, we want to fit a line to the data. In order to determine which line fits best, we must look at the R-squared values for each line. We do this because R-squared is the correlation coefficient which measures how well the fitted line predicts the values. R-squared ranges from 0 to 1, where the closer to one R-squared is, the better the fit. By determining which line fits best, we can then fill in other values.
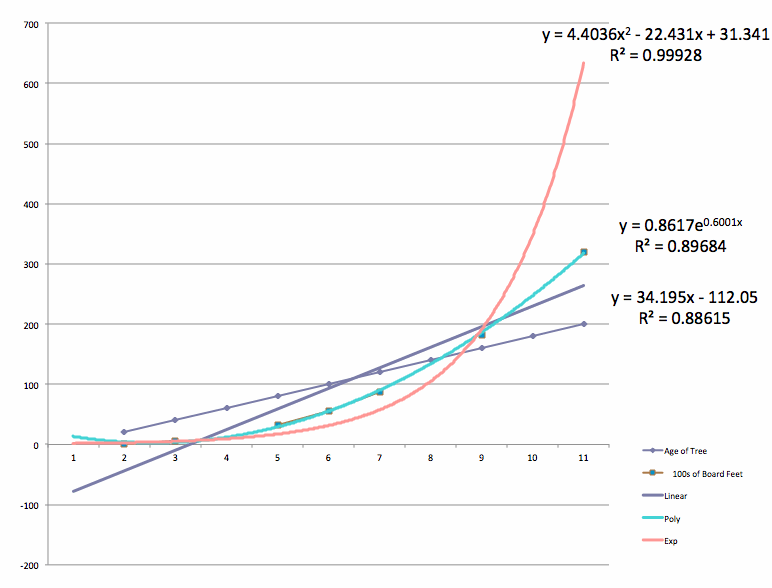
We see that the green line fits the data best. This is a polynomial equation and we know it is best fitted because the R-squared value is closest to 1 at 0.99928. So this is what our graph and equation will look like:
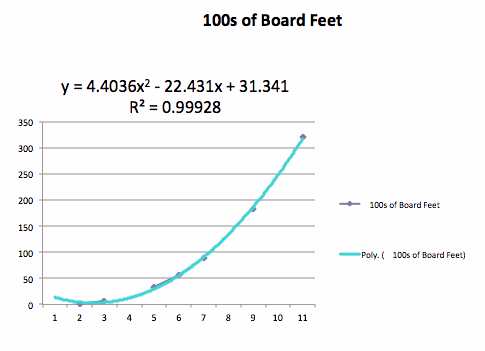
We will use this equation to fill in the rest of the table by plugging in the formula.
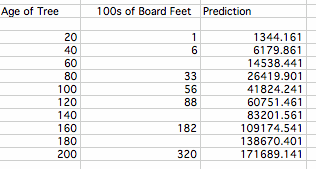
(Here is excel sheet I used)